Problem
Retail order data often starts as separate operational files for orders, items, customers, products, stores, and payments, making it hard to trust revenue metrics without repeatable loading, modeling, and reconciliation.
Data Engineering
Synthetic retail orders moved through S3, Snowflake medallion layers, Gold star schema marts, audit checks, and a live Streamlit dashboard.
Orders
50,000
Gold fact rows
150,195
dbt tests
50 passed
This section gives the quick context of the project. It explains what problem the project solves, how I approached it, and what came out of the work.
Retail order data often starts as separate operational files for orders, items, customers, products, stores, and payments, making it hard to trust revenue metrics without repeatable loading, modeling, and reconciliation.
Built a hands-on batch warehouse project that generates synthetic retail data, lands raw files in S3, loads Snowflake Bronze tables, models Silver and Gold layers with dbt, validates quality through Audit tables, and publishes a Streamlit dashboard from the Gold star schema.
Snowflake medallion warehouse with Bronze source tables, Silver staging views, Gold star schema tables, and Audit evidence tables.
This section shows how the data moves from source to final output. The goal is to make the pipeline easier to understand without reading the implementation code first.
Airflow DAG scaffold defines the repeatable flow for data generation, S3 upload, Snowflake Bronze loading, dbt runs, dbt tests, and audit summary publishing.
This section explains the tools used in the project. The source badge explains where the data comes from, while the stack badges show the tools used to turn it into a usable data product.
For data generation, I use Python, Faker, pandas, and synthetic CSV files to create realistic source files that make the warehouse pipeline practiceable without depending on private production data. This gives the project a structured data foundation instead of a one-off spreadsheet or hardcoded dashboard file.
For cloud landing, I use AWS S3, run-date partitions, and boto3 upload helper to store raw evidence in a traceable landing area, keep files organized by source and run date, and make reruns easier to audit.
In the warehouse layer, I use Snowflake, Storage Integration, and BRONZE/SILVER/GOLD/AUDIT schemas to keep raw, staging, mart, and audit data separated so the final tables are easier to validate and consume. This gives the project a structured data foundation instead of a one-off spreadsheet or hardcoded dashboard file.
For transformation, I use dbt Core, dbt Snowflake, Silver views, and Gold star schema to turn loaded observations into clean staging models, dimensions, fact tables, and freshness-aware analytics outputs. This confirms the warehouse source is recent enough for the dashboard and analysis use case.
For orchestration and delivery, I use Airflow DAG, Docker Compose, Streamlit, and Plotly to make the pipeline repeatable and expose the final modeled data through a dashboard experience. This is the part a stakeholder can open to understand trends without reading the pipeline code.
For quality and developer workflow, I use dbt tests, Audit models, GitHub, and PowerShell helper scripts to test assumptions, document the run, and keep the project reproducible from local development to portfolio review. These tests act like guardrails that catch broken relationships, missing values, or suspicious prices before the data is trusted.
This section explains how the project was built step by step. Each stage is written as a short narrative so the process is easier to follow from discovery to delivery.
Generate synthetic source files. Created dummy retail datasets for customers, products, stores, orders, order items, and payments. Used run_date as a runtime parameter so manual runs and Airflow scheduled runs can write traceable partitions.
Land raw files in S3. Uploaded six raw CSV files to an S3 prefix partitioned by run date. Used Snowflake Storage Integration instead of embedding AWS access keys in stage SQL. This helps analysts reuse the logic without redefining the same metric from scratch.
Load and model medallion layers. Loaded S3 files into Snowflake Bronze tables. Built dbt Silver staging views for cleaned and standardized order, item, customer, product, store, and payment records. Built dbt Gold tables as a star schema for dashboard consumption. This is the part a stakeholder can open to understand trends without reading the pipeline code.
Validate warehouse quality. Added dbt tests for not-null keys, uniqueness, accepted values, and fact-to-dimension relationships. Created Audit models for row counts, revenue reconciliation, missing key checks, duplicate checks, and negative revenue checks. These tests act like guardrails that catch broken relationships, missing values, or suspicious prices before the data is trusted.
Publish dashboard. Built a Streamlit dashboard that queries Snowflake Gold and Audit tables directly. Deployed the dashboard to Streamlit Community Cloud and documented the read-only Snowflake user setup. This is the part a stakeholder can open to understand trends without reading the pipeline code.
This section shows the final user-facing result. It helps reviewers see what the modeled data becomes after the pipeline, warehouse, and dashboard layers are connected.
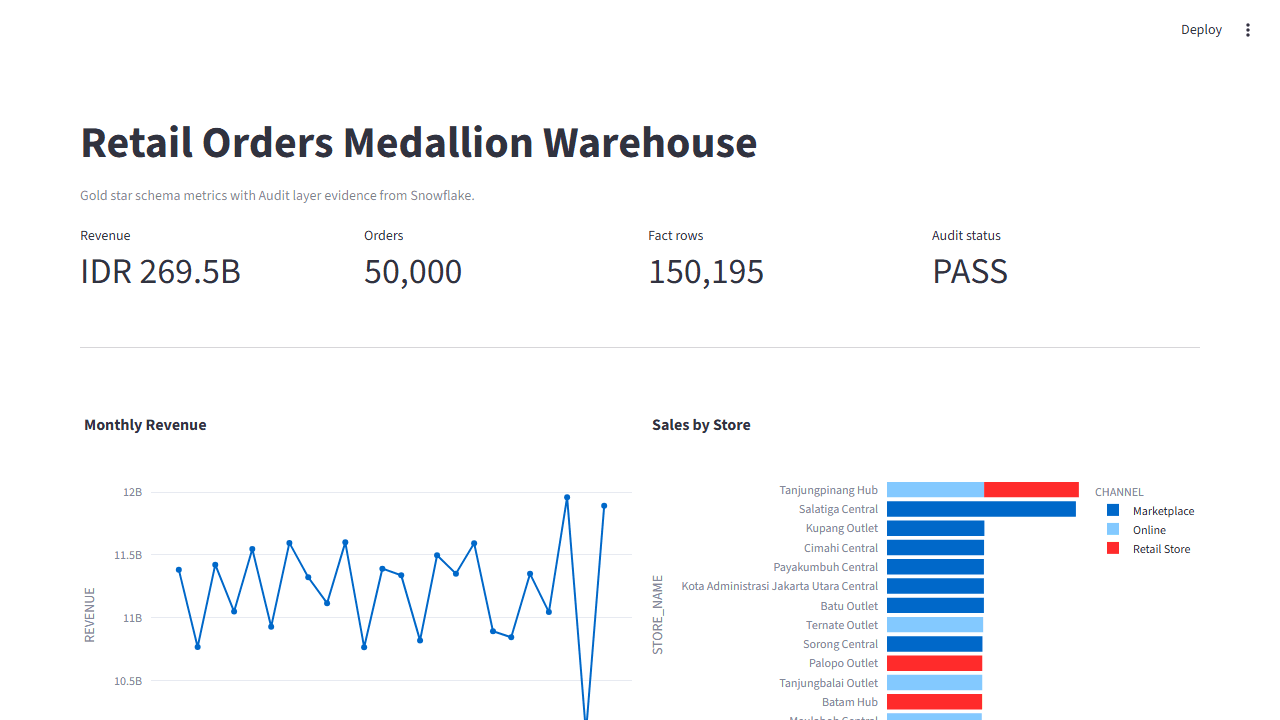
This section explains how the warehouse tables are organized. The layers show how raw data becomes cleaner, easier to query, and safer to use for dashboards or analysis.
The BRONZE layer keeps the first warehouse copy of the source data. In this project, Bronze stores the first Snowflake copy of the S3 CSV sources for customers, products, stores, orders, order items, and payments. This layer makes the S3-loaded records traceable before cleaning or business modeling happens. This gives the project a structured data foundation instead of a one-off spreadsheet or hardcoded dashboard file.
The SILVER layer is where loaded records become cleaner and more consistent. In this project, Silver dbt views standardize field names, types, statuses, and reusable staging logic before data is used by BI models. This keeps standardization separate before the data is shaped into business-facing tables.
The GOLD layer is the BI-ready layer. In this project, Gold contains the BI-ready star schema. FACT_ORDER_ITEMS is the central fact table with one row per order item. DIM_CUSTOMER, DIM_PRODUCT, DIM_STORE, DIM_DATE, and DIM_PAYMENT_METHOD provide the descriptive dimensions used for slicing revenue and order metrics. This is where the star schema lives, with a central fact table connected to dimensions for dashboard slicing and review. This is the part a stakeholder can open to understand trends without reading the pipeline code.
The AUDIT layer stores checks and summaries that explain whether the pipeline output can be trusted. In this project, Audit tables store row-count evidence, revenue reconciliation, and quality checks so the dashboard can show both business metrics and trust signals. This helps reviewers see row counts, coverage, and invalid data checks without manually inspecting every table. This is the part a stakeholder can open to understand trends without reading the pipeline code.
This section explains how I checked that the data can be trusted. The goal is to make the project reviewable, not just visually complete.
S3 landing uses run-date partitions so each raw file batch can be traced to a pipeline run.
Snowflake stage access uses Storage Integration, avoiding committed AWS keys or credential-heavy stage definitions.
dbt built 15 models across Silver, Gold, and Audit layers.
dbt test suite passed 50 checks covering accepted values, not-null fields, uniqueness, relationships, audit reconciliation, and audit quality status. These tests act like guardrails that catch broken relationships, missing values, or suspicious prices before the data is trusted.
Audit revenue reconciliation matched Bronze order item net amount to Gold fact net amount with a 0.00 difference.
The live dashboard reads from Snowflake Gold and Audit tables, not local CSV files. This is the part a stakeholder can open to understand trends without reading the pipeline code.
S3 raw objects
6
Orders
50,000
Order item fact rows
150,195
Gold dimensions
5
dbt models
15
dbt tests
50 passed
Revenue reconciliation
PASS
Net amount diff
0.00
Dashboard status
Live
These are the final deliverables from the project. They show what someone can actually inspect, reuse, or open after the pipeline work is done.
Snowflake medallion warehouse with Bronze source tables, Silver staging views, Gold star schema tables, and Audit evidence tables. This gives the project a structured data foundation instead of a one-off spreadsheet or hardcoded dashboard file.
dbt project with 15 models and 50 passing tests across Silver, Gold, and Audit layers.
Live Streamlit dashboard backed by Snowflake Gold marts and Audit quality evidence. This is the part a stakeholder can open to understand trends without reading the pipeline code.
Open the live dashboard
Review revenue trends, top products, store performance, customer segments, payment methods, and audit status from Snowflake-backed Gold and Audit tables.