Problem
Commodity price signals are spread across public sources and hard to compare consistently by date, price layer, market, and commodity.
Data Engineering
Public Indonesian consumer and producer prices into governed Snowflake marts and a BI-ready dashboard.
Raw rows
2,233
dbt tests
14 passed
Cloud stack
S3 + Snowflake
This section gives the quick context of the project. It explains what problem the project solves, how I approached it, and what came out of the work.
Commodity price signals are spread across public sources and hard to compare consistently by date, price layer, market, and commodity.
Built an end-to-end ELT workflow that scrapes public price pages, stores raw audit files in S3, loads Snowflake raw tables, models dimensional marts with dbt, and exposes consumer-vs-producer trends through Streamlit.
Snowflake warehouse with daily price fact table and source, region, commodity, and date dimensions.
This section shows how the data moves from source to final output. The goal is to make the pipeline easier to understand without reading the implementation code first.
Airflow DAG orchestrates scraping, S3 upload, Snowflake load, dbt transformation, and quality checks.
This section explains the tools used in the project. The source badge explains where the data comes from, while the stack badges show the tools used to turn it into a usable data product.
In collection, I use Python, requests, BeautifulSoup, and pandas to fetch public pages, parse source tables, normalize raw fields, and prepare the data before it moves into the warehouse flow. This gives the project a structured data foundation instead of a one-off spreadsheet or hardcoded dashboard file.
For cloud landing, I use AWS CLI, AWS S3, boto3, and partitioned raw objects to store raw evidence in a traceable landing area, keep files organized by source and run date, and make reruns easier to audit.
In the warehouse layer, I use Snowflake, RAW/STAGING/MARTS/AUDIT schemas, and X-Small warehouse with auto-suspend to keep raw, staging, mart, and audit data separated so the final tables are easier to validate and consume. This gives the project a structured data foundation instead of a one-off spreadsheet or hardcoded dashboard file.
For transformation, I use dbt Core, dbt Snowflake, SQL models, and source freshness to turn loaded observations into clean staging models, dimensions, fact tables, and freshness-aware analytics outputs. This confirms the warehouse source is recent enough for the dashboard and analysis use case.
For orchestration and delivery, I use Airflow DAG, Docker Compose, Streamlit, and Plotly to make the pipeline repeatable and expose the final modeled data through a dashboard experience. This is the part a stakeholder can open to understand trends without reading the pipeline code.
For quality and developer workflow, I use pytest, dbt tests, PowerShell helper scripts, and Git-ready docs to test assumptions, document the run, and keep the project reproducible from local development to portfolio review. These tests act like guardrails that catch broken relationships, missing values, or suspicious prices before the data is trusted.
This section explains how the project was built step by step. Each stage is written as a short narrative so the process is easier to follow from discovery to delivery.
Source discovery. Compared public Indonesian market price sources and avoided marketplace scraping for v1 because of compliance and anti-bot risk. Selected Bapanas national consumer and producer price tables because they provide historical rows that are useful for trend analysis.
Scrape and normalize. Fetched public HTML pages with a portfolio user agent and rate limits. Parsed commodity, year, month, and price from official tables. Normalized records into source, observed date, region, market, commodity, unit, and IDR price.
Land raw evidence. Stored raw responses and scrape audit logs locally first. Uploaded raw files to S3 using source/run-date partitions for traceability. Configured S3 public access blocking and a 30-day lifecycle rule for development cost control.
Load and model warehouse. Initialized Snowflake warehouse, database, schemas, and RAW table. Loaded normalized observations into RAW.MARKET_PRICES with LOAD_RUN_DATE so reruns stay controlled. Built dbt staging, dimensions, fact table, and audit summary models. This helps separate one pipeline run from another, so repeated loads are easier to control.
Validate and deliver. Ran dbt tests for accepted values, not-null fields, unique observation IDs, fact-to-dimension relationships, and price sanity. Ran source freshness against RAW.MARKET_PRICES. Published a Streamlit dashboard from Snowflake marts for trends, markup, volatility, and data quality. These tests act like guardrails that catch broken relationships, missing values, or suspicious prices before the data is trusted.
This section shows the final user-facing result. It helps reviewers see what the modeled data becomes after the pipeline, warehouse, and dashboard layers are connected.
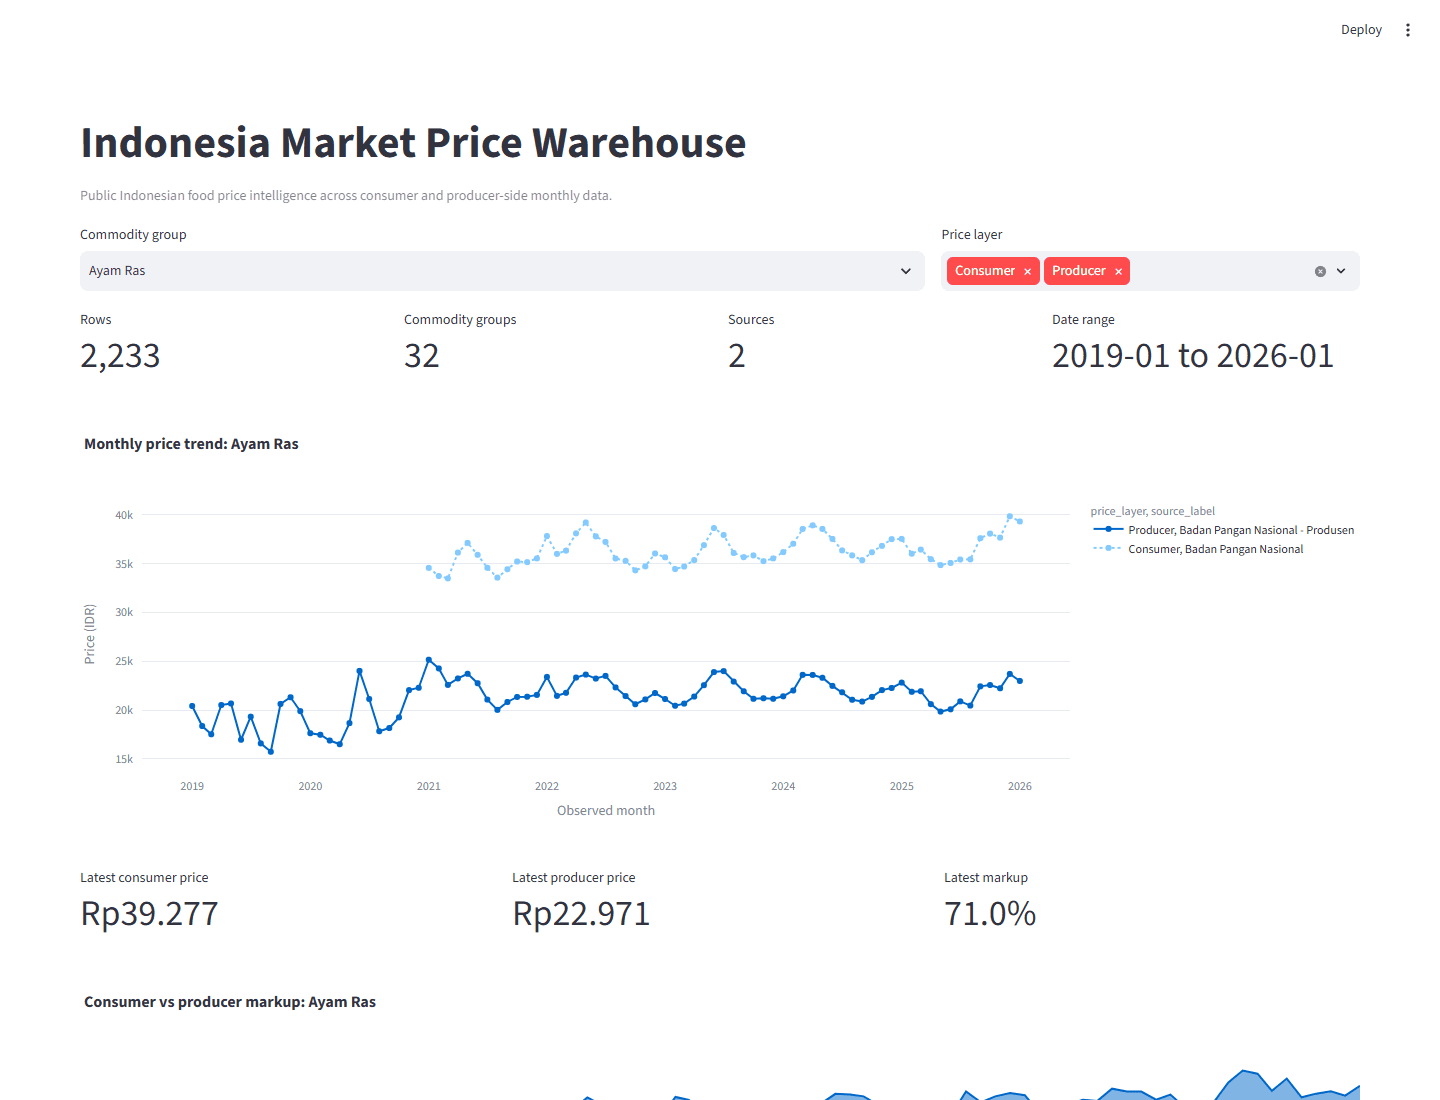
This section explains how the warehouse tables are organized. The layers show how raw data becomes cleaner, easier to query, and safer to use for dashboards or analysis.
The RAW layer keeps the first loaded version of the data as close to the source as possible. In this project, RAW.MARKET_PRICES stores normalized observations loaded from the scraper output. This layer is useful for auditing because it lets me compare the final numbers back to the original loaded records.
The STAGING layer is where the raw data starts becoming clean and consistent. In this project, STAGING.STG_MARKET_PRICES cleans naming, filters invalid prices, and creates stable observation IDs. This keeps naming, filtering, and basic validation separate before the data is used by marts.
The MARTS layer is the business-ready layer. In this project, MARTS.FACT_DAILY_PRICES contains one row per source, date, market, and commodity observation. MARTS.DIM_SOURCE separates consumer and producer layers. MARTS.DIM_COMMODITY, DIM_REGION, and DIM_DATE support dashboard slicing. This is the layer that dashboard users or analysts should query because the tables already follow clearer grains and dimensions. This is the part a stakeholder can open to understand trends without reading the pipeline code.
The AUDIT layer stores checks and summaries that explain whether the pipeline output can be trusted. In this project, AUDIT.DATA_QUALITY_SUMMARY and AUDIT.PRICE_SANITY summarize row count, coverage, date range, and invalid price checks. This helps reviewers see row counts, coverage, and invalid data checks without manually inspecting every table. This makes the result easier to trust because the checks are visible, not hidden in the implementation.
This section explains how I checked that the data can be trusted. The goal is to make the project reviewable, not just visually complete.
Raw source responses are preserved before transformation so final metrics can be traced back to source pages. In simple terms, this keeps the original evidence available so the final dashboard numbers are not treated as a black box.
S3 objects are partitioned by source and run date, making reruns and audits easier to inspect. This makes it easier to find which source and run produced a file when the pipeline needs to be reviewed.
Snowflake loads include LOAD_RUN_DATE to avoid uncontrolled duplicates when the same run is repeated. This helps separate one pipeline run from another, so repeated loads are easier to control.
dbt test suite passed 14 checks covering accepted sources, non-null fields, uniqueness, relationships, and price sanity. These tests act like guardrails that catch broken relationships, missing values, or suspicious prices before the data is trusted.
dbt source freshness passed for RAW.MARKET_PRICES. This confirms the warehouse source is recent enough for the dashboard and analysis use case.
S3 raw objects
5
Snowflake raw rows
2,233
Fact rows
2,233
Commodity dimension
42 rows
Dashboard groups
32 groups
Date coverage
2019-01 to 2026-01
Sources in mart
2 layers
Invalid prices
0
Freshness
PASS
These are the final deliverables from the project. They show what someone can actually inspect, reuse, or open after the pipeline work is done.
Snowflake warehouse with daily price fact table and source, region, commodity, and date dimensions. This gives the project a structured data foundation instead of a one-off spreadsheet or hardcoded dashboard file.
dbt models and tests covering warehouse quality and freshness. This confirms the warehouse source is recent enough for the dashboard and analysis use case.
Streamlit dashboard for market price trends, markup monitoring, and stakeholder-friendly analytics. This is the part a stakeholder can open to understand trends without reading the pipeline code.
Review the data product
Open the dashboard-style preview for commodity price trends, consumer-vs-producer markup, volatility, and data quality status.